In Part 1 of this Resilience Unpacked series on Sustainability-Linked Financing for Climate Resilience, we explored the largely untapped potential of sustainability-linked bonds (SLBs) and loans (SLLs) to drive progress on climate adaptation and resilience. Despite their success in supporting mitigation goals, our research found that these instruments have only rarely been used to target adaptation outcomes. However, the growing application of water-related KPIs in SLBs and SLLs may offer a meaningful entry point for change.
In Part 2, we dig deeper into how water-related KPIs and SPTs are currently used in SLBs and SLLs across different sectors. We’ll examine how these indicators map against industry benchmarks, any emerging trends and practices shaping this evolving landscape.
Assembling the Evidence Base
To understand current practices, we analysed a dataset of 151 SLBs and SLLs issued between 2019 and 2024 that included water-related KPIs. This data was sourced from the Environmental Finance Database. Our research focused on four water intensive but key priority sectors: i) agri-processing, ii) manufacturing & services iii) property & tourism and iv) primary agriculture. After filtering out instruments from sectors outside our scope and transactions without disclosed KPIs, we identified 36 relevant SLBs and SLLs comprising 20 bonds and 16 loans for further analysis.
These transactions span a range of sectors and geographies, offering valuable insight into how water-related targets are structured in real sustainability-linked finance deals. They also provide a practical foundation for assessing the ambition and comparability of these targets against established industry benchmarks.
Anchoring to Benchmarks: What’s Available and What’s Missing
One of the key challenges in assessing SPT ambition is the absence of standardised benchmarks across sectors. To address this, our analysis drew on several existing reference points:
- EU BREFs
These are comprehensive, technical resources that detail the Best Available Technologies (BAT) for a plethora of industries. While the focus is on integrated pollution prevention and control across industries, they often include information on energy, water use and wastewater management. These documents offer granular, production process level industry benchmarks that, while useful, require careful interpretation to avoid misapplication outside their specific industrial context. As a result, we based our analysis on BREF water benchmarks.
- Buildings industry benchmarks
We referenced environmental benchmarks developed by the Better Buildings Partnership (BBP) to support our analysis of the property & tourism sector. These provide practical environmental benchmarks for commercial buildings, such as offices and shopping centres. However, their specificity to commercial buildings such as office blocks and shopping malls means they are not directly applicable to other building types like residential buildings.
- Food & Agriculture Organisation (FAO) resources
We reviewed water-related data and guidance from the FAO AQUASTAT database as well as other FAO resources to support our analysis of the primary agriculture sector. While rich in information, methodological uncertainties around target-setting in primary agriculture prevented us from fully integrating these benchmarks into our analysis.
Water-Related KPI Categories in Practice
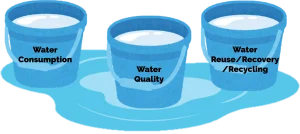
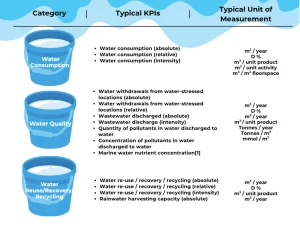
Our analysis revealed that water-related KPIs in SLBs and SLLs generally fall into three main categories: water consumption, water quality, and water reuse/recovery/recycling.
Water Consumption: These KPIs are the most widely used. These may be measured in absolute terms (e.g. cubic metres per year), in relative terms (e.g. percentage reduction in water consumption), or in terms of intensity – for example, water consumption per unit of product in manufacturing, per unit of activity in services, or per square metre in real estate. Some KPIs also focus specifically on water consumption from water-stressed regions, either in absolute or relative terms.
Water Quality: These KPIs tend to focus on the volume of wastewater discharged, either in absolute terms or in specific intensity terms and are commonly cited in BREFs. Some KPIs are qualitative and used to measure the wastewater pollutant load in terms of pollutant quantity or concentration.
Water Reuse/Recovery/Recycling: These KPIs are used in several sectors. These may be framed in absolute, relative, or intensity terms. A few transactions also include rainwater harvesting targets, although these are less common.
Table 1: Categorisation of water-related KPIs identified in the evidence base
Assessing Target Ambition: The Role of Second Party Opinions
In the absence of universally accepted benchmarks, SPTs in SLBs and SLLs are typically assessed by Second Party Opinion (SPO) providers. These providers use qualitative categories such as “insufficiently ambitious,” “moderately ambitious,” “ambitious,” and “highly ambitious” to rate the strength of a given target. While methodologies vary and are not always disclosed in full, two criteria consistently emerge.
First, SPOs often assess whether the target represents a meaningful improvement on the issuer’s past performance. This relies on transparent reporting of historic water use, which can be a challenge for some companies. Second, SPOs consider whether the target exceeds what is typical for the issuer’s sector. This comparative analysis depends on the availability of peer targets or recognised benchmarks, which are uneven across sectors.
Together, these criteria underscore the importance of both internal and external reference points in credible SPT design and the need for more consistent disclosure and benchmarking tools.
Sector-Specific Trends and Observations
The 36 SLBs and SLLs analysed reveal some important sector-level differences in how water-related KPIs and SPTs are used.
In the Agri-Processing sector, most water targets relate to consumption intensity, particularly in the beverage production sub-sector. Here, an ambitious target often involves a 10–20% reduction in water consumption intensity per unit (litre) of product. EU BREFs for the food, drink and milk industries also provide useful benchmarks for wastewater discharge intensity per unit of product, particularly in industries like brewing.
The Manufacturing & Services sector is highly diverse, spanning industries as different as pharmaceuticals, chemicals, paper & packaging, mining and logistics & services. Water KPIs here cover a broad range from water consumption in absolute terms in pharmaceutical production to wastewater discharge intensity in chemicals, plastics & rubber and paper & packaging, as well as water reuse/recovery/recycling in logistics & services. Given this diversity, setting credible targets requires deep industry-specific knowledge and benchmarking.
In the Property & Tourism sector, water consumption intensity is the dominant metric. Here, BBP benchmarks offer a relatively robust reference point for target setting. There is also at least one example of targets related to rainwater harvesting, although such these remain rare.
In contrast, the Primary Agriculture sector remains largely absent from the sustainability-linked finance landscape when it comes to water KPIs. Despite agriculture being the largest consumer of freshwater globally, our analysis found only one SPT in the livestock sub-sector, targeting absolute wastewater discharge. No examples were found for crop production despite it requiring the most significant amounts of water. While the ICMA KPI Registry provides many KPI recommendations, our research found little evidence of their practical use to set SPTs.
Looking Ahead
Our analysis across this Resilience Unpacked series highlights both the progress and the gaps in how water-related KPIs are used in SLBs & SLLs. While levels of rigour and benchmarking vary, what’s clear is that water offers a unique entry point for linking finance to resilience outcomes. Water is deeply connected to the impacts of climate change and increasingly measurable through performance-based metrics making it a natural candidate for integrating adaptation goals into mainstream financial instruments.
If we are to unlock the full potential of sustainability-linked finance for climate resilience, water-related KPIs could help lead the way. They offer a concrete, scalable foundation on which to build stronger, more credible frameworks that channel capital towards adaptation.
Thank you for following along with this Resilience Unpacked series on Sustainability-Linked Financing for Climate Resilience. Stay tuned for more from our Resilience Unpacked insights series and more!